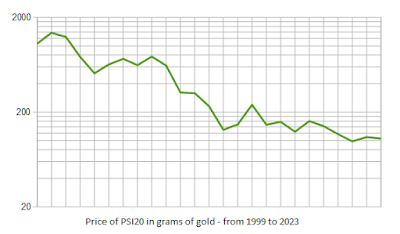
Here's a chart of the price of the PSI20 index measured in grams of gold. My available data goes back only to 1999, and we are therefore getting a single leg of a mega-cycle. We registered a top in 2000, when the PSI20 hit 1200 grams of gold, and we're currently scarping a bottom at around 100 grams of gold for the PSI20.
 |
| PSI20/Gold ratio |
Note that the graph is logarithmic, and it's spanning two decades. Anyone who chose to sell their gold in 2000 to buy shares in the PSI20 have lost more than 90% on their invested gold. On the other hand, anyone who sold the PSI20 in 2000 to buy gold can go back in and get about 12 times more shares than they sold in 2000.
This illustrates the power of long term investing. We can also deduce from this that we must be near a bottom. It's not inconceivable that we have some more to go on the down-leg, but a long term investor may do well in starting to roll gold into the PSI20 at this point. However, I'll wait a little longer because the PSI20/gold ratio is unlikely to move up in an environment where other indexes move down, and the Dow/gold ratio is still in bubble territory. My signal for rolling into the PSI20 will come when the Dow/gold ratio goes below 4.
No comments:
Post a Comment